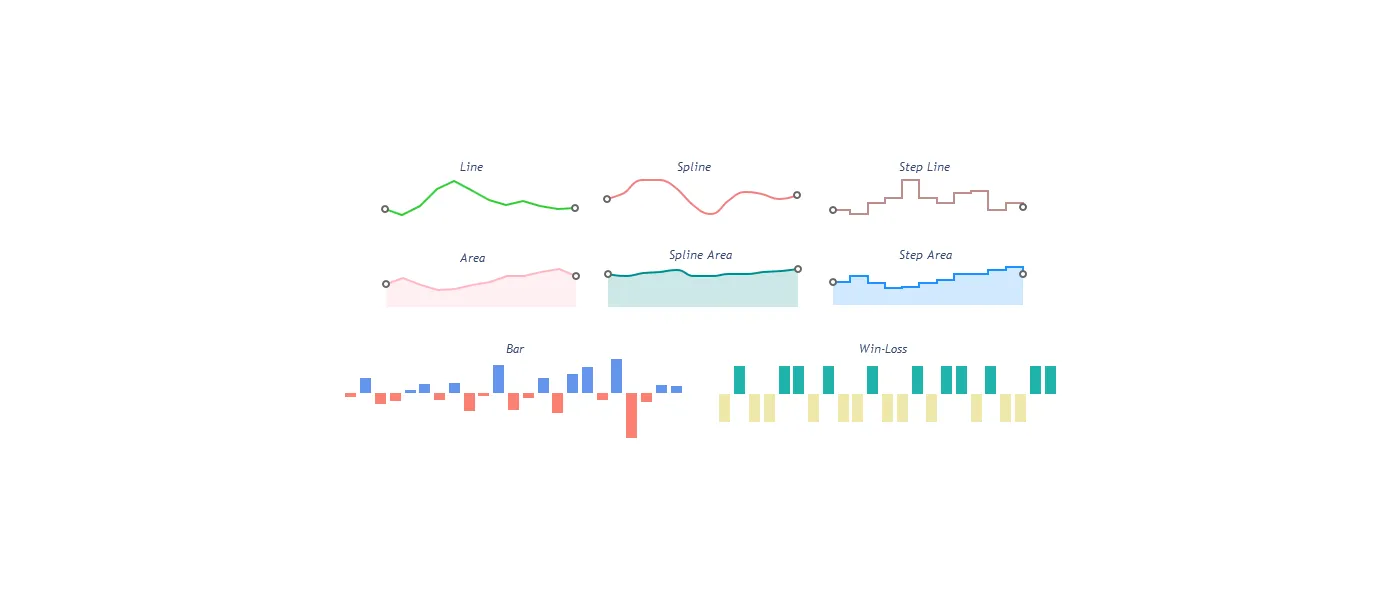
Today we are going to show you how to use a tinny but useful library called <a href="https://github.com/htmlwidgets/sparkline"><strong>sparkline</strong></a>. <em>Sparkline</em> itself is a small widget that uses jQuery under the hood<sup id="fnref:1"><a class="footnote" href="#fn:1">1</a></sup>. Both technologies - jQuery and the widget itselt are implemented in JavaScript. JavaScript has superpowers when it comes to visualizations and almost always exceeds anything we can get with other languages. That’s the main reason why people using Python, R or anything else want to use JavaScript. In case of R it is possible thanks to <em>htmlwidgets</em><sup id="fnref:3"><a class="footnote" href="#fn:3">2</a></sup> package, which we are going to describe in another article. <h1 id="examples">Examples</h1> Lets get straight to the point and look at some examples. <strong>Install:</strong> As this package is not available at CRAN we need to install it with <em>devtools</em><sup id="fnref:2"><a class="footnote" href="#fn:2">3</a></sup>: <figure class="highlight"> <pre><code class="language-r" data-lang="r"><span class="n">library</span><span class="p">(</span><span class="n">devtools</span><span class="p">)</span> <span class="err">#</span> <span class="n">install_github</span><span class="p">(</span><span class="s1">'htmlwidgets/sparkline'</span><span class="p">)</span></code></pre> </figure> We need some data to play with. In this case we’re going to use weather forecasts for New York: <figure class="highlight"> <pre><code class="language-r" data-lang="r"><span class="n">library</span><span class="p">(</span><span class="n">SmarterPoland</span><span class="p">)</span> <span class="n">library</span><span class="p">(</span><span class="n">sparkline</span><span class="p">)</span> <span class="n">warsawWeather</span> <span class="o"><-</span> <span class="n">getWeatherForecast</span><span class="p">(</span><span class="n">getOption</span><span class="p">(</span><span class="s2">"DarkSkyApiKey"</span><span class="p">),</span> <span class="n">city</span> <span class="o">=</span> <span class="s2">"New York"</span><span class="p">)</span> <span class="n">nextWeekTemperature</span> <span class="o"><-</span> <span class="n">warsawWeather</span><span class="o">$</span><span class="n">by.day</span><span class="o">$</span><span class="n">temperatureMaxCelsius</span> <span class="n">sparkline</span><span class="p">(</span><span class="n">nextWeekTemperature</span><span class="p">)</span></code></pre> </figure> <!--html_preserve--> <span id="htmlwidget-0ffe020476f2096cad8b" class="sparkline html-widget"></span> <script type="application/json" data-for="htmlwidget-0ffe020476f2096cad8b">{"x":{"values":[27.3111111111111,28.1666666666667,23.3277777777778,26.4333333333333,27.0444444444444,30.7666666666667,31.7166666666667,31.1],"options":{"height":20,"width":60},"width":60,"height":20},"evals":[],"jsHooks":[]}</script><!--/html_preserve--> <h1 id="types-of-charts">Types of charts</h1> Sparkline has several flavors. <ol><li>Bar chart <!--html_preserve--><span id="htmlwidget-11903b480a4888c98132" class="sparkline html-widget"></span><script type="application/json" data-for="htmlwidget-11903b480a4888c98132">{"x":{"values":[27.3111111111111,28.1666666666667,23.3277777777778,26.4333333333333,27.0444444444444,30.7666666666667,31.7166666666667,31.1],"options":{"type":"bar","height":20,"width":60},"width":60,"height":20},"evals":[],"jsHooks":[]}</script><!--/html_preserve--> where we can adjust bar colors<!--html_preserve--><span id="htmlwidget-283c6a57d7062fc7b7b7" class="sparkline html-widget"></span><script type="application/json" data-for="htmlwidget-283c6a57d7062fc7b7b7">{"x":{"values":[27.3111111111111,28.1666666666667,23.3277777777778,26.4333333333333,27.0444444444444,30.7666666666667,31.7166666666667,31.1],"options":{"type":"bar","barColor":"red","height":20,"width":60},"width":60,"height":20},"evals":[],"jsHooks":[]}</script><!--/html_preserve--></li><li>Boxplot: <!--html_preserve--><span id="htmlwidget-1c30c9d8bd5d0b0b01b5" class="sparkline html-widget"></span><script type="application/json" data-for="htmlwidget-1c30c9d8bd5d0b0b01b5">{"x":{"values":[27.3111111111111,28.1666666666667,23.3277777777778,26.4333333333333,27.0444444444444,30.7666666666667,31.7166666666667,31.1],"options":{"type":"box","height":20,"width":"400px"},"width":"400px","height":20},"evals":[],"jsHooks":[]}</script><!--/html_preserve--></li><li>Bullet graph: <!--html_preserve--><span id="htmlwidget-813cfd434c834b7749db" class="sparkline html-widget"></span><script type="application/json" data-for="htmlwidget-813cfd434c834b7749db">{"x":{"values":[7,8.5,5,8,10],"options":{"type":"bullet","height":20,"width":60},"width":60,"height":20},"evals":[],"jsHooks":[]}</script><!--/html_preserve--></li><li>And of course pie chart: <!--html_preserve--><span id="htmlwidget-1620d6d0cf5988408a5b" class="sparkline html-widget"></span><script type="application/json" data-for="htmlwidget-1620d6d0cf5988408a5b">{"x":{"values":[-2,-3,0,3,-4,4,1,5,2,-1],"options":{"type":"pie","height":20,"width":60},"width":60,"height":20},"evals":[],"jsHooks":[]}</script><!--/html_preserve--></li></ol> You can also use two types <em>tristate</em> and <em>discrete</em>, however I’ve never used those two until this time (check out documentation if you curious!). I’ve shown how you can pass arguments to plots in the examples. A Precise explaination of all options and configurations is available in <a href="http://omnipotent.net/jquery.sparkline">jQuery plugin documentation</a>. <h1 id="boosting">Boosting</h1> It gets even better if we embed sparkline within tables with data. Familiar with formattable? You will be! <div id="htmlwidget_container"> <div id="htmlwidget-8685" class="formattable_widget html-widget-static-bound" style="width: 100%;"> <table class=" table table-condensed"> <thead> <tr> <th class="text-right">Large</th> <th class="text-right">small</th> <th class="text-right">Rank</th> </tr> </thead> <tbody> <tr> <td align="right">A</td> <td align="right">d</td> <td align="right"><span id="htmlwidget-2541" class="sparkline"></span><script type="application/json" data-for="htmlwidget-2541">{"x":{"values":[3,4,1,5,2],"options":{"height":20,"width":60},"width":60,"height":20},"evals":[],"jsHooks":[]}</script></td> </tr> <tr> <td align="right">B</td> <td align="right">c</td> <td align="right"><span id="htmlwidget-2541" class="sparkline"></span><script type="application/json" data-for="htmlwidget-2541">{"x":{"values":[3,4,1,5,2],"options":{"height":20,"width":60},"width":60,"height":20},"evals":[],"jsHooks":[]}</script></td> </tr> <tr> <td align="right">C</td> <td align="right">b</td> <td align="right"><span id="htmlwidget-2541" class="sparkline"></span><script type="application/json" data-for="htmlwidget-2541">{"x":{"values":[3,4,1,5,2],"options":{"height":20,"width":60},"width":60,"height":20},"evals":[],"jsHooks":[]}</script></td> </tr> <tr> <td align="right">D</td> <td align="right">a</td> <td align="right"><span id="htmlwidget-2541" class="sparkline"></span><script type="application/json" data-for="htmlwidget-2541">{"x":{"values":[3,4,1,5,2],"options":{"height":20,"width":60},"width":60,"height":20},"evals":[],"jsHooks":[]}</script></td> </tr> </tbody> </table> </div> </div> <figure class="highlight"> <pre><code class="language-r" data-lang="r"><span class="n">library</span><span class="p">(</span><span class="n">formattable</span><span class="p">)</span> <span class="n">library</span><span class="p">(</span><span class="n">sparkline</span><span class="p">)</span> <br><span class="n">formattable</span><span class="p">(</span> <span class="n">data.frame</span><span class="p">(</span><span class="n">Large</span> <span class="o">=</span> <span class="nb">LETTERS</span><span class="p">[</span><span class="m">1</span><span class="o">:</span><span class="m">4</span><span class="p">],</span> <span class="n">small</span> <span class="o">=</span> <span class="nb">letters</span><span class="p">[</span><span class="m">4</span><span class="o">:</span><span class="m">1</span><span class="p">],</span> <span class="n">Rank</span> <span class="o">=</span> <span class="kc">NA</span><span class="p">),</span> <span class="nf">list</span><span class="p">(</span> <span class="s2">"Rank"</span><span class="o">=</span><span class="k">function</span><span class="p">(</span><span class="n">z</span><span class="p">)</span> <span class="p">{</span> <span class="n">sapply</span><span class="p">(</span> <span class="n">paste0</span><span class="p">(</span><span class="n">text</span><span class="o">=</span><span class="s1">'`r htmltools::tagList(sparkline(sample(5)))`'</span><span class="p">)</span> <span class="p">,</span><span class="k">function</span><span class="p">(</span><span class="n">md</span><span class="p">)</span> <span class="n">knitr</span><span class="o">::</span><span class="n">knit</span><span class="p">(</span><span class="n">text</span><span class="o">=</span><span class="n">md</span><span class="p">,</span> <span class="n">quiet</span><span class="o">=</span><span class="nb">T</span><span class="p">)</span> <span class="p">)</span> <span class="p">}</span> <span class="p">)</span> <span class="p">)</span></code></pre> </figure> <label class="margin-toggle" style="font-size: 0.8em; text-decoration: underline;" for="‘mn-trick’"><i class="fa fa-sticky-note" aria-hidden="true"></i> sticky note</label><input id="‘mn-trick’" class="margin-toggle" type="checkbox" /><span class="marginnote">I had to use a small trick here. Who knows what I did? </span> Formattable lets you do that and more when it comes to presenting your data in readable form. It has its own htmlwidget as well. <h1 id="what-next">What next?</h1> For those of you who think that charts in the browser are mainstream I recommend working with command line. spark <label class="margin-toggle sidenote-number" for="‘sn-sick’"></label><input id="‘sn-sick’" class="margin-toggle" type="checkbox" /><span class="sidenote">Not the best choice when it comes to the name of the library. </span> is a simillar package to sparkline, but it renders charts straight in the command line! <figure class="highlight"> <pre><code class="language-text" data-lang="text">## ▄▂▁▃▃▁▅▆▅▇▇▆▅▃▄▄▅▃▂▁▁▂▃▃▃▃▂▅▅▅▄████ ## ▁▃▁▂▂▁▂▄▄▆▇▇▇██▇█▇▇▆▆▇▇▇█▇▆▇▇▇▆▇██▇ ## ▅▄▁▁▂▁▂▄▄▄▄▄▄▄▄▄▅▅▆▅▄▄▄▅▅▄▄▆▆▆▆████ ## ▁▁▁▂▂▂▂▃▄▃▅▆▆▅▅▆▇▇▇▇▇▇▇▇█▇▆▇█▆▆▇███</code></pre> </figure> <style> .post-image-image {<br /> background-position: center;<br />}<br /></style> <div class="footnotes"> <ol><li id="fn:1"><a href="https://jquery.com/">jQuery</a> is an old but still very popular library that allows to quickly implement various actions on websites (like animations, DOM manipulations, async calls). jQuery is replaced more and more often with some modern tools, but for some basic projects this is still good way to go. <a class="reversefootnote" href="#fnref:1">↩</a>[REF]: <a href="https://jquery.com/">jQuery</a> is an old but still very popular library that allows to quickly implement various actions on websites (like animations, DOM manipulations, async calls). jQuery is replaced more and more often with some modern tools, but for some basic projects this is still good way to go.[/REF]</li><li id="fn:3">Not the patient type? <a href="http://www.htmlwidgets.org/index.html">htmlwidgets</a> <a class="reversefootnote" href="#fnref:3">↩</a></li><li id="fn:2">I assume you have devtools installed. If not run install.packages(“devtools”). If like me, you prefer to use most recent version of packages look at the README.md in github repository <a href="https://github.com/hadley/devtools">devtools</a>. <a class="reversefootnote" href="#fnref:2">↩</a></li></ol> </div>
Contact us!


.png)